Click and drag to create a region. Double-click to zoom in. Double-click again to reset.
MET-MAP: Spatial metabolic gradients in the liver and small intestine
About MET-MAP
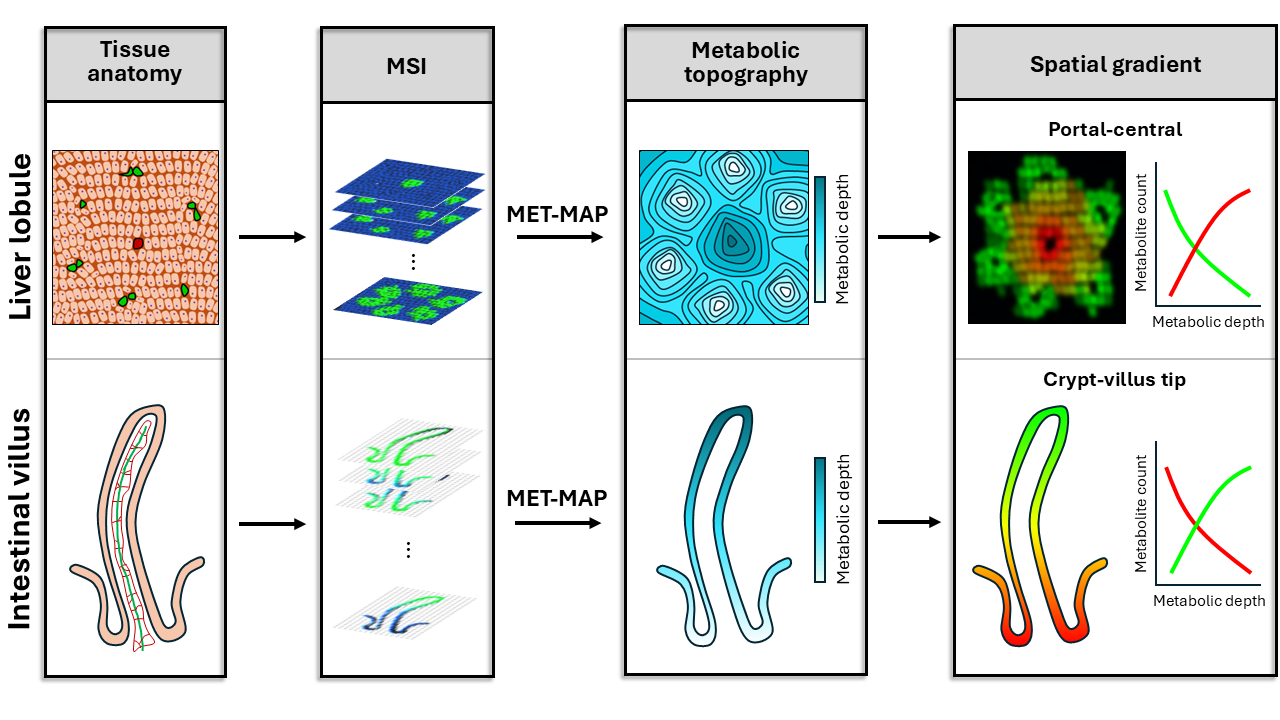
This app provides interactive visualization of spatial metabolite distributions and metabolic gradients in murine liver and small-intestine epithelium. Users can explore the metabolic topography which delineates liver portal-central and intestinal crypt-villus-tip metabolic gradients. Users can also view images and spatial gradients for selected metabolites and lipids acquired by MALDI imaging mass spectrometry.


Click and drag to create a region. Double-click to zoom in. Double-click again to reset.